Electron-density analysis of halide · · · halide through-space magnetic exchange
- Roger Johnson
- Session 6 , Chemical Bonding
- Tuesday, July 15, 2025
- 12:10 pm
Rebecca Scatenaa, Zachary E. Manson b, Jamie L. Manson b, David R. Allan a, Paul A. Goddard c and Roger D. Johnson d,e
aDiamond Light Source, Rutherford Appleton Laboratory–STFC, Chilton, Didcot OX11 0QX, United Kingdom; b Department of Chemistry and Biochemistry, Eastern Washington University, Cheney, Washington 99004, USA; c Department of Physics, University of Warwick, Gibbet Hill Road, Coventry CV4 7AL, United Kingdom d Department of Physics and Astronomy, University College London, Gower Street, London WC1E 6BT, United Kingdom e London Centre for Nanotechnology, University College London, Gower Street, London WC1E 6BT, United Kingdom.
e-mail: roger.johnson@ucl.ac.uk
We present a combined experimental and density functional theory study that characterizes the charge and spin density in NiX2(3,5-lutidine)4 (X = Cl, Br and I). In this material, magnetic exchange interactions occur via Ni2+–halide … halide–Ni2+ pathways, forming one-dimensional chains. We find evidence for weak halide…halide covalency in the iodine system, which is greatly reduced when X = Br and is absent for X = Cl; this is consistent with the reported ‘switching-on’ of magnetic exchange in the larger-halide cases. Our results are benchmarked against density functional theory calculations on [NiHF2-(pyrazine)2]SbF6, in which the primary magnetic exchange is mediated by F–H–F bridging ligands. This comparison indicates that, despite the largely depleted charge density found at the centre of halide…halide bonds, these through-space interactions can support strong magnetic exchange gated by weak covalency and enhanced by significant electron density overlapping that of the transition metal centres [1].
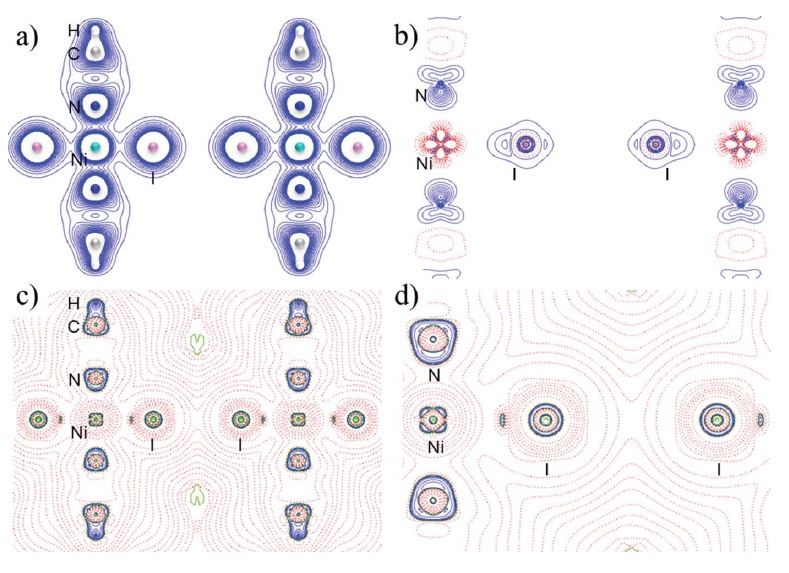
Results from the multipolar model for NiI2(3,5-lutidine)4 in terms of (a) charge density distribution, (b) static deformation density contour level where blue and red represent, respectively, the excess and depletion of electron density with respect to the spherical atom distribution, (c) Laplacian function of the charge density with positive contours drawn as solid blue lines indicating regions of charge concentration and negative contours shown as red dotted lines highlighting regions of charge depletion, and (d) highlight of the Laplacian in the Ni–I…I region.
References:
[1] R. Scatena et al., J. Appl. Cryst. (2025). 58, 363–373